In the world of forex trading, candlestick patterns play a crucial role in helping traders make informed decisions. These patterns are visual representations of price movements and provide valuable insights into market sentiment. Whether you are a beginner or an experienced trader, understanding candlestick patterns can significantly enhance your trading strategies. In this article, we will delve into the top 7 candlestick patterns that every forex trader should know to maximize their trading potential.
What Are Candlestick Patterns?
Candlestick patterns are visual representations of price movements in the Forex market. They are formed by the open, close, high, and low prices during a specific time frame. Traders use these patterns to predict future price movements and identify potential trading opportunities.
The Top 7 Candlestick Patterns for Forex Trading
1. Hammer Candlestick
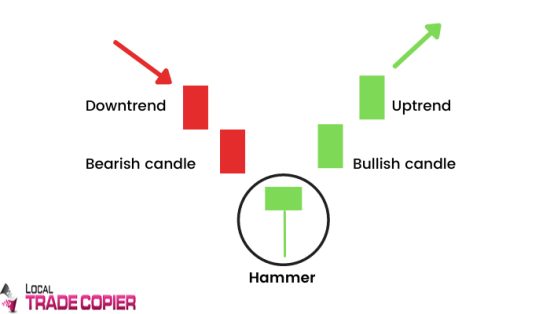
The Hammer Candlestick Pattern is a powerful reversal pattern that signals a potential change in the direction of the market. It resembles a hammer, with a small body and a long lower wick.
2. Doji Candlestick
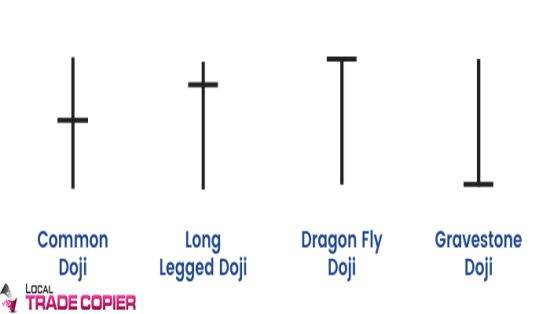
The Doji candlestick is a neutral pattern that indicates market indecision. It occurs when the open and close prices are nearly the same, resulting in a small real body.
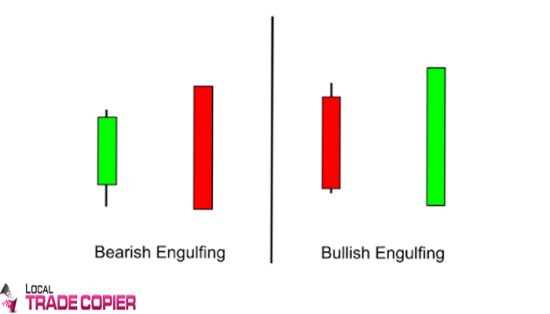
3. Bullish/Bearish Engulfing Candlestick
This pattern signals a potential bullish reversal. It forms when a small bearish candlestick is followed by a larger bullish candlestick that engulfs the previous one.
Conversely, the Bearish Engulfing pattern suggests a potential bearish reversal. It occurs when a small bullish candlestick is followed by a larger bearish candlestick.
4. Shooting Star Candlestick
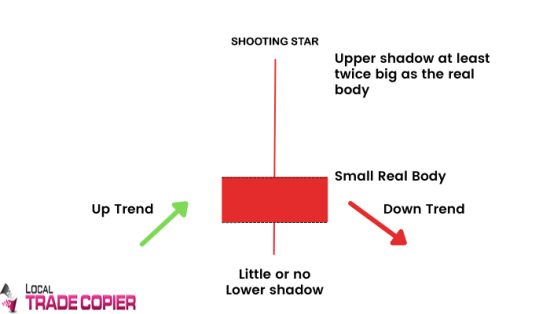
The Shooting Star candlestick pattern is similar to the Hammer but appears after an uptrend. It signals a potential bearish reversal and often indicates that the market could turn in favor of the sellers.
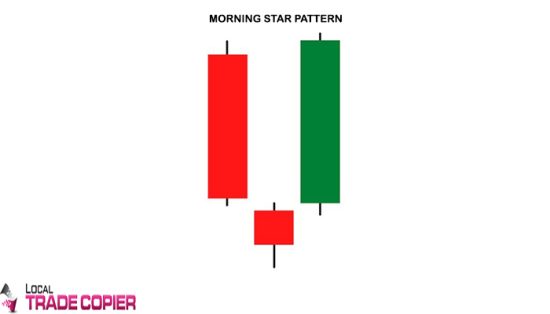
 5. Morning Star Candlestick
The Morning Star candlestick is a bullish reversal pattern that consists of three candles: a large bearish candle, a small bullish or bearish candle, and a large bullish candle. It signifies a potential trend reversal from bearish to bullish.
6. Evening Star Candlestick
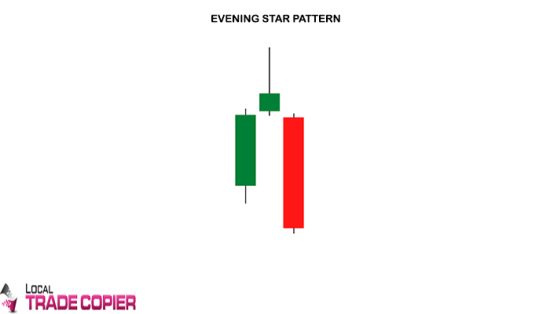
The Evening Star is the opposite of the Morning Star and indicates a potential bearish reversal. It consists of a large bullish candle, a small bullish or bearish candle, and a large bearish candle.
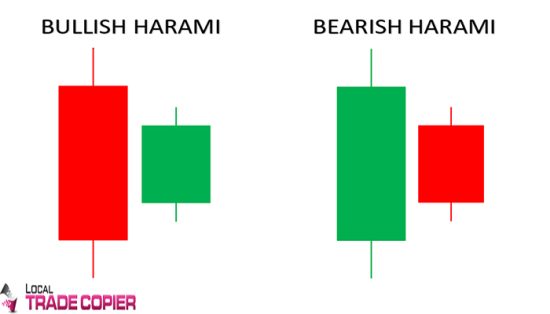
 7. Harami Candlestick
The Harami pattern is a reversal pattern that consists of two candles. The first candle is large, followed by a small candle that is completely engulfed by the first one. It suggests a potential trend change.
Conclusion
In Forex trading, understanding candlestick patterns is a valuable skill that can enhance your decision-making process. The top 7 patterns mentioned in this article, can provide valuable insights into market movements. However, it’s essential to combine these patterns with other technical analysis tools for more accurate trading strategies.
FAQs
1. What is the significance of candlestick patterns in Forex trading?
Ans. Candlestick patterns provide visual cues about market sentiment and potential price reversals, helping traders make informed decisions.
2. How can I use the Hammer Candlestick Pattern in my trading strategy?
Ans. The Hammer signals a potential bullish reversal. To use it effectively, wait for confirmation from subsequent candlesticks and consider other technical indicators.
3. Are candlestick patterns foolproof indicators for trading?
Ans. No, candlestick patterns are not foolproof and should be used in conjunction with other technical analysis tools and risk management strategies.
4. What time frames are suitable for analyzing candlestick patterns?
Ans. Candlestick patterns can be applied to various timeframes, but their effectiveness may vary. Traders often use them on daily and hourly charts.
5. Can candlestick patterns be used in conjunction with fundamental analysis?
Ans. Yes, combining candlestick patterns with fundamental analysis can provide a more comprehensive view of the Forex market and enhance trading strategies.
